
Assignment 11:
Polar Equations
by
Jenny Johnson
What are polar equations?
First,
we need to understand that polar equations are graphed on the polar coordinate
system, which is a two-dimensional coordinate system wherein a point on the
plane (r, θ) is determined by the distance r from the origin and
the angle θ
from the positive x-axis, measured counter-clockwise. An
example of a point z on the polar coordinate system is shown below.
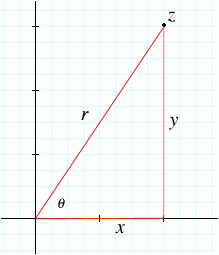
Clearly,
polar coordinates (r, θ) of a point are related to the x- and y-coordinates of a
point. Considering the picture
above, we can see the red lines form a right triangle. Using basic trigonometry, we see that
the length of the leg of the right triangle on the x-axis would be x = r cos θ and the length of
the leg parallel to the y-axis would be
y = r sin θ.
Polar equations are algebraic curves expressed in
polar coordinates. For polar
equations in this exploration we will define r as a function of θ. The curves (graphs of the
polar functions r) will consist of points in the form (r(θ), θ).
First, let’s consider the graph of r = 1. Based on our definition, this is the
set of points a constant distance r from the origin (r does not depend on
θ). So, this would be the
unit circle.
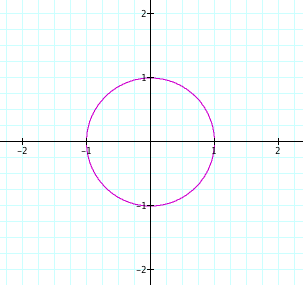
Similarly,
all graphs of r = a where a is a constant will be circles centered at the
origin with radius a.
What does the graph of r = a θ look like?
Let’s
consider the graph of the polar equation r = a θ when a = 1 as θ ranges from 0
to 2π.
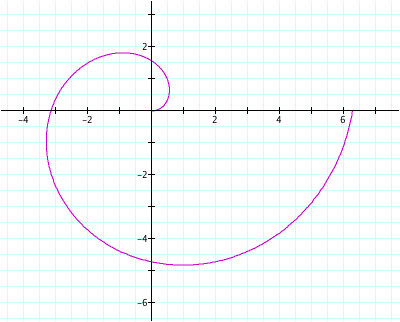
It is interesting to note that the curve crosses
the x-axis at (-π, 0) and (2
π, 0). This makes sense since r will
be a distance of π from the origin
(since r = θ ) when θ is π radians from the
x-axis, and r will equal 2π when r is 2π radians from the origin. Here are some other curves of the form
r = a θ.
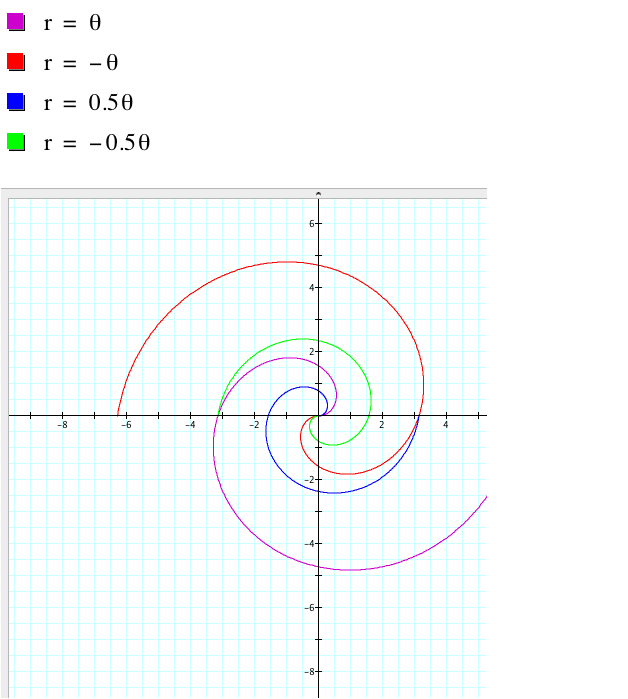
Notice that when a is negative, the curve is a
reflection in the x-axis and the y-axis of the curve when a is positive. Also, the curve of r = 0.5 θ
crosses the x-axis at (-π/2, 0) and (π,0) since r will be half the length of
the value of θ. So when θ
is π radians from the origin, r will be a distance of π/2 from the origin and
when θ is 2π radians from the origin (back on the positive x-axis), then r
will be a distance of π from the origin.
Let
us consider the curves of a few other polar equations.
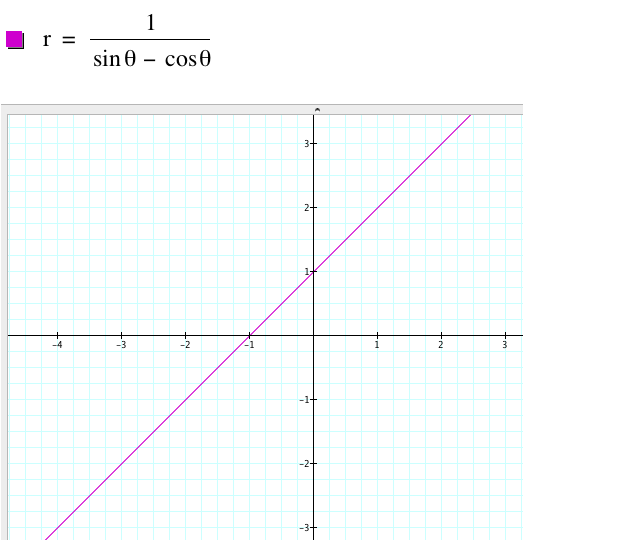
This is a line. What if we substituted 2θ for each θ in
the equation above?
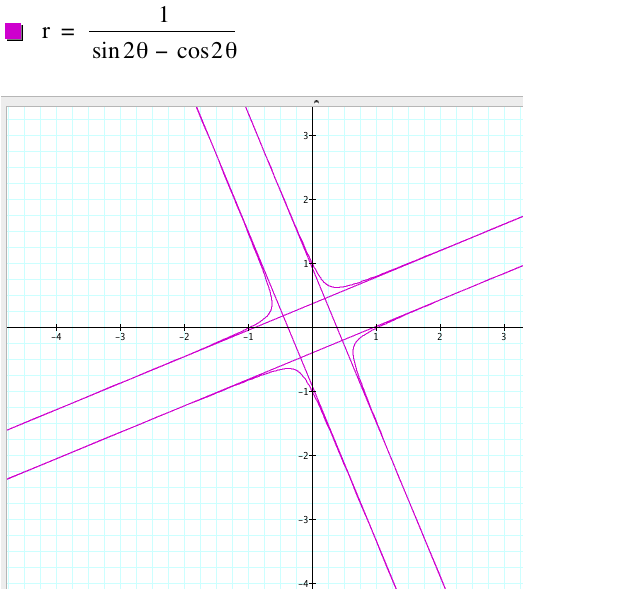
What if we
substituted θ/2
for 2θ in this equation?
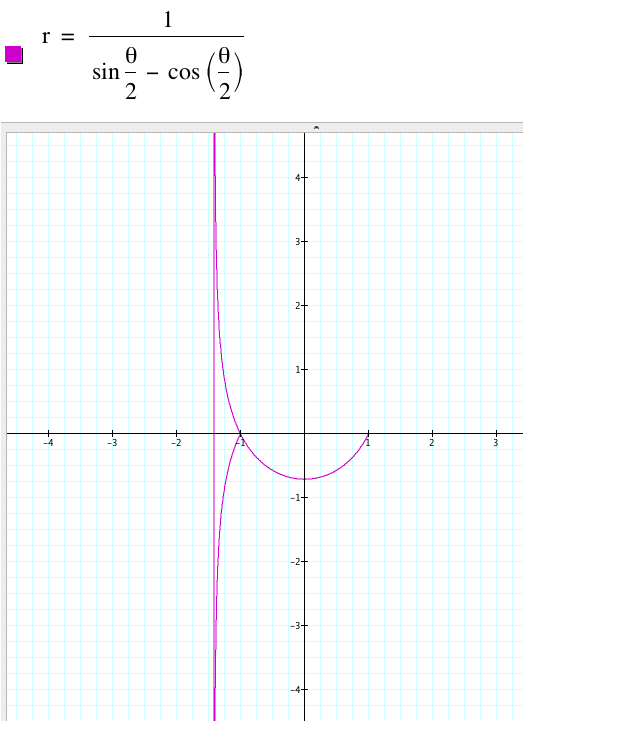
All of these curves
have been very different. Watch a
movie of the curves of the following form 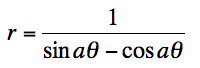 as a ranges from -10 to 10.
What does the graph of r = a cos θ look like?
When a = 1, and θ
ranges from 0 to 2 , we get
the following graph.
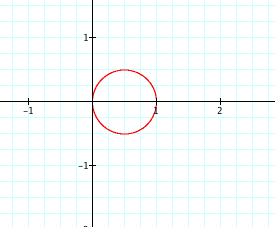
The
graph is a circle with radius a/2 centered at (a/2, 0). What if a = 2?
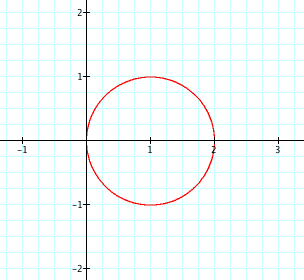
This
graph is also a circle with radius a/2 with a center of (a/2, 0). Now let’s look at the algebraic curve
of r = 2 cos θ
– 1.
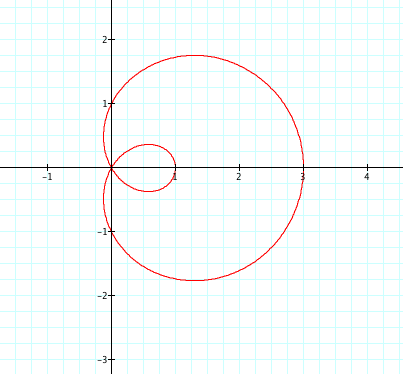
This is an
interesting curve. We can watch a
movie of the curve r = a cos θ - 1 to see to see the curve as a ranges from -10 to 10.
What if we were to graph the curve of r = 2 cos (θ – 1)?
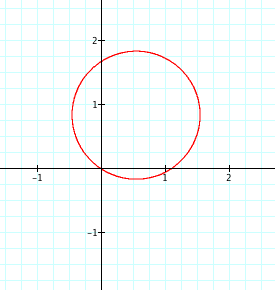
It
looks like the same size circle as r = 2 cos θ, but shifted up and to the
left.
What does the graph of r =
a/ θ look like?
First, we observe the
graph when a = 1.
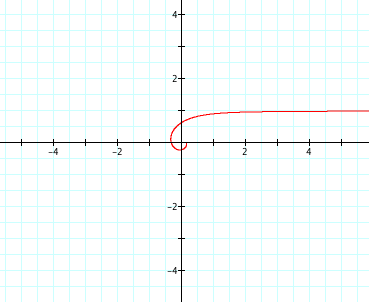
This
graph is a curve whose maximum y-value is a (when we extend out the x-axis, the
curve never gets above 1). Will
this same thing occur when a = 2?
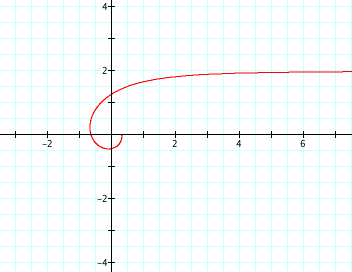
Yes. The graph of r = 2/ θ is a curve
with a maximum y-value of a. Watch
this movie that shows the curve of r = a/ θ as a ranges from -10 to 10.
Let
us explore a few more graphs of polar equations.
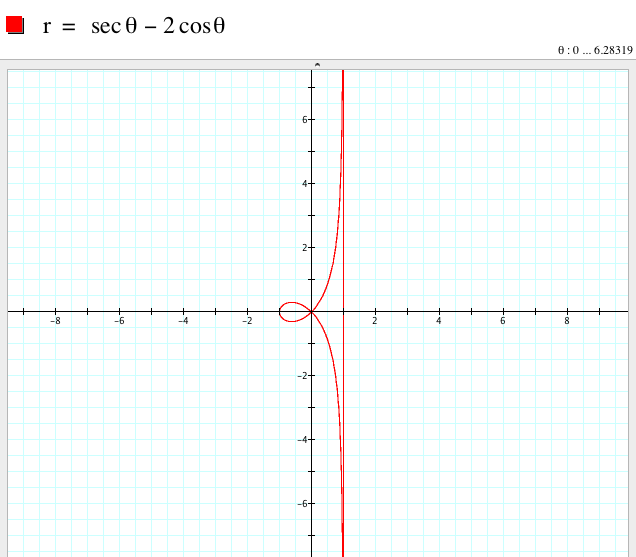
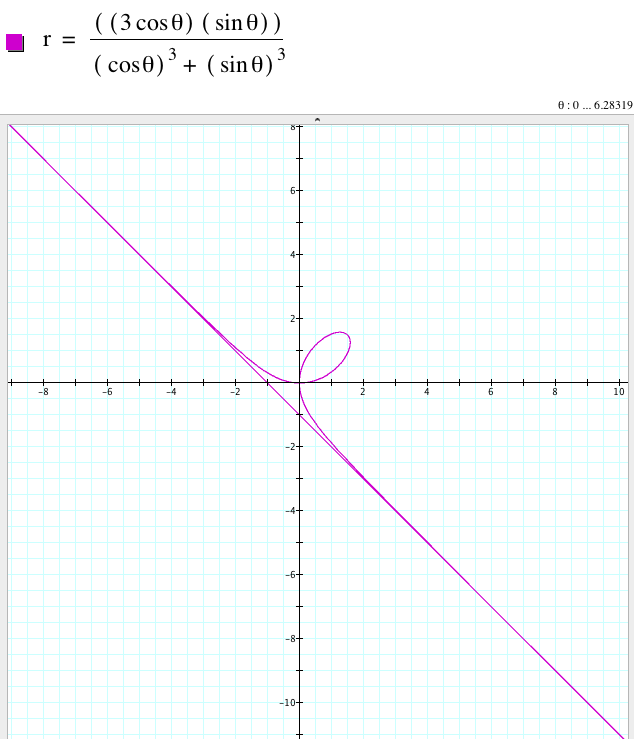
These two curves are
very similar.
Now let’s examine
the graph from above in a movie by changing the value of 10 to n and allowing
it to range from -10 to 10.